“Delay is the deadliest form of denial.”
- Cyril Parkinson, British Naval Historian
Today, we live in a world that is constantly changing, becoming more complex and changes are more unpredictable. This presents significant challenges to Enterprises looking to accelerate their digital transformation. Many events take place completely unexpectedly and understanding root causes has often become very challenging. In this VUCA (volatility, uncertainty, complexity, and ambiguity) world, reducing the time to insight holds the key for improved business performance and results.
Data analytics is seen as a key enabler to help organizations with their digital transformation by not only improving the time-to-value, but also helping in making better decisions and reducing operational costs. A research report published in MIT’s Sloan Management Review (SMR) says that for Fortune 1000 executives reducing the time-to-insight is the primary driver for their data analytics investment [1]. So, how can organizations leverage the power of real-time analytics?
With this backdrop, this blog is part of a 3-series blog (WHAT? SO WHAT? NOW WHAT?) to understand the real-time analytics thoroughly to guide the implementation of the real-time analytics solution in business enterprises. Specifically, this blog looks at three main “What, So What, Now What” elements: WHAT is real-time analytics? SO, WHAT is the impact or business benefits of real-time analytics in improving business performance? Finally, NOW WHAT is the solution or capabilities needed for realizing real-time analytics in business.
First things first. WHAT exactly is real-time analytics? Before we go there, let’s start with the definition of data analytics. Basically, data analytics asks questions to gain insights using data for better decision making [4]. At the core, data analytics is about measurement and performance improvement. But given that data is a record of past events and circumstances pertaining to a particular measurement entity, how can data analytics be truly real-time? Is real-time analytics a misnomer?
Basically, when we say real-time analytics, it is using data as soon as it is collected to derive insights for decision making. Gartner defines real-time analytics as: “The discipline that applies logic and mathematics to data to provide insights for making better decisions quickly. For some use cases, real time simply means the analytics is completed within a few seconds or minutes after the arrival of new data.” [2] Overall, real-time analytics which enables businesses to react to the available data with minimal delay can be of two main types.
- On-demand real-time analytics where users or systems wait to execute a query and to analyze the results.
- Continuous real-time analytics which is more proactive than on-demand real-time, alerts users or triggers responses as events happen using predefined business rules.
However, most business enterprises take a lot of time to integrate data from diverse sources of systems into a single view or database. This unified view is often known as the data warehouse and is used in the data science models to query the data to derive insights. This latency is adversely affecting the capability to derive faster insights or real-time analytics. SO WHAT, is the business impact? What difference does the lack of real-time analytics make to the business? What will an organization lose by not having the capabilities to perform real-time analytics?
Today many IT systems are collecting data from IoT machines, user interactions, operational infrastructure, and more. This type of data is known as streaming data or time series data fundamentally contextual. Hence businesses want to analyze data as soon as it is captured to capitalize on the potential business opportunities.
In this backdrop, the common complaint in many organizations is – “We run businesses every day, but we get reports every quarter”. Basically, delayed decision is practically a bad decision. Nucleus research found that the weighted average half-life of a data element is about 8 hours. In simple words, the value of the data for insights reduces by 50% in 8 hours [7].
This high latency results in a big difference between an insight that is derived after weeks versus insights that is generated in seconds. Those small-time deltas can make a big difference especially when critical services and other time sensitive business opportunities are at risk. Detecting credit card fraud, forecasting demand on the electricity grid, e-commerce purchases to target consumers with promotions and incentives, and more applications depend on real-time analytics or rather near real-time analytics.
So, if an organization is not able to harness data quickly, the quality of the decision degrades quickly or often the decision might even become irrelevant. In this regard, the sequel to this blog will look at the key real-time analytics use-cases.
Now, given that real time analytics can make a significant impact to business performance, NOW WHAT? What capabilities are needed for realizing real time analytics? A typical data analytics solution rests on five core capabilities or building blocks: data culture, data literacy, technology tools in the entire data lifecycle, quality data, and data governance [Southekal, 2020].
While data culture, data literacy, quality data, and data governance, are applicable to all analytics and data solutions, this blog with go deeper into the technology tools required for real-time analytics. Specifically, it will look at the key technical capabilities needed to deliver real time analytics.
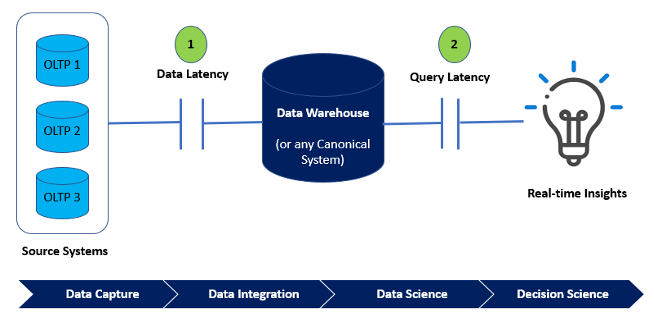
As discussed above, real-time analytics is about minimizing the latency associated with data ingestion into the data warehouse and querying of data in the data warehouse. In other words, real-time analytics should address data latency and query latency. Data latency is a measure of the time from when data is generated to when it is queryable. As there is usually a time lag between when the data is collected and when it is available to query, real-time analytics systems should minimize the lag associated in getting the data to the data warehouse.
Query latency is the amount of time it takes to execute a query on the data in the data warehouse and receive the output. Unlike the throughput KPI, the query latency is less dependent on the application and does not vary with demand like the throughput. The relationship is as shown in the figure below.
Overall, the key to real-time analytics in reducing the latency or the response times is bringing the data to the data warehouse and executing the query faster. The third part of this blog series will look at the key capabilities associated in bringing a holistic real-time analytics solution.
Today, organizations aiming to accelerate their digital transformation are looking at ways to quickly derive insights from data analytics to make faster decisions for better business results. Research by McKinsey Consulting found that companies that are insight-driven report above-market growth and EBITDA (earnings before interest, taxes, depreciation, and amortization) increases up to 25 percent [3].
However, many data analytics programs do not deliver business results. Gartner says, only 20 percent of the data Analytics solutions deliver business outcomes [4]. A report in VentureBeat says, 87 percent of Data Analytics projects never make it to production [5]. A BCG report found that while many companies have high data ambitions on data analytics, only a few achieve those ambitions [6].
While there are many options to improve the success rates, one solution to improve the adoption of data analytics is to offer the power of real-time analytics directly to users who are closer to data and business.
References
- https://sloanreview.mit.edu/article/how-time-to-insight-is-driving-big-data-business-investment/
- https://www.gartner.com/en/information-technology/glossary/real-time-analytics
- Mckinsey, "Breaking away: The secrets to scaling analytics", https://www.mckinsey.com/business-functions/mckinsey-analytics/our-insights/breaking-away-the-secrets-to-scaling-analytics, May, 2018
- Southekal, Prashanth, "Analytics Best Practices", Technics Publications, 2020
- VentureBeat, “Why do 87% of data science projects never make it into production?”, https://venturebeat.com/2019/07/19/why-do-87-of-data-science-projects-never-make-it-into-production/, Jul 2019
- https://www.bcg.com/en-ca/publications/2020/how-data-can-create-competitive-advantage
- https://nucleusresearch.com/wp-content/uploads/2018/05/m36-Guidebook-Measuring-the-half-life-of-data.pdf
About the Author
 Dr. Prashanth Southekal is the Managing Principal of DBP Institute (www.dbp-institute.com), data and analytics consulting, research and education firm. He is a Consultant, Author, and Professor. He has consulted for over 75 organizations including P&G, GE, Shell, Apple, and SAP. Dr. Southekal is the author of two books — “Data for Business Performance” and "Analytics Best Practices” — and writes regularly on data, analytics, and machine learning in Forbes.com, FP&A Trends, and CFO.University.
ANALYTICS BEST PRACTICES is in the top 100 analytics books of all time and in May 2022 was ranked #1 by BookAuthority. Apart from his consulting pursuits, he has trained over 3,000 professionals worldwide in Data and Analytics. Dr. Southekal is also an Adjunct Professor of Data and Analytics at IE Business School (Madrid, Spain). CDO Magazine included him in the top 75 global academic data leaders of 2022. He holds a Ph.D. from ESC Lille (FR) and an MBA from Kellogg School of Management (U.S.). He lives in Calgary, Canada with his wife, two children, and a high-energy Goldendoodle dog. Outside work, he loves juggling and cricket.